Grafana
In addition to providing archiver status by way of EPICS PVs, archstats optionally can write to an elasticsearch database for long-term statistics. This type of document database is natively supported by Kibana and Grafana.
An example Grafana dashboard that looks like the following is provided in this repository:
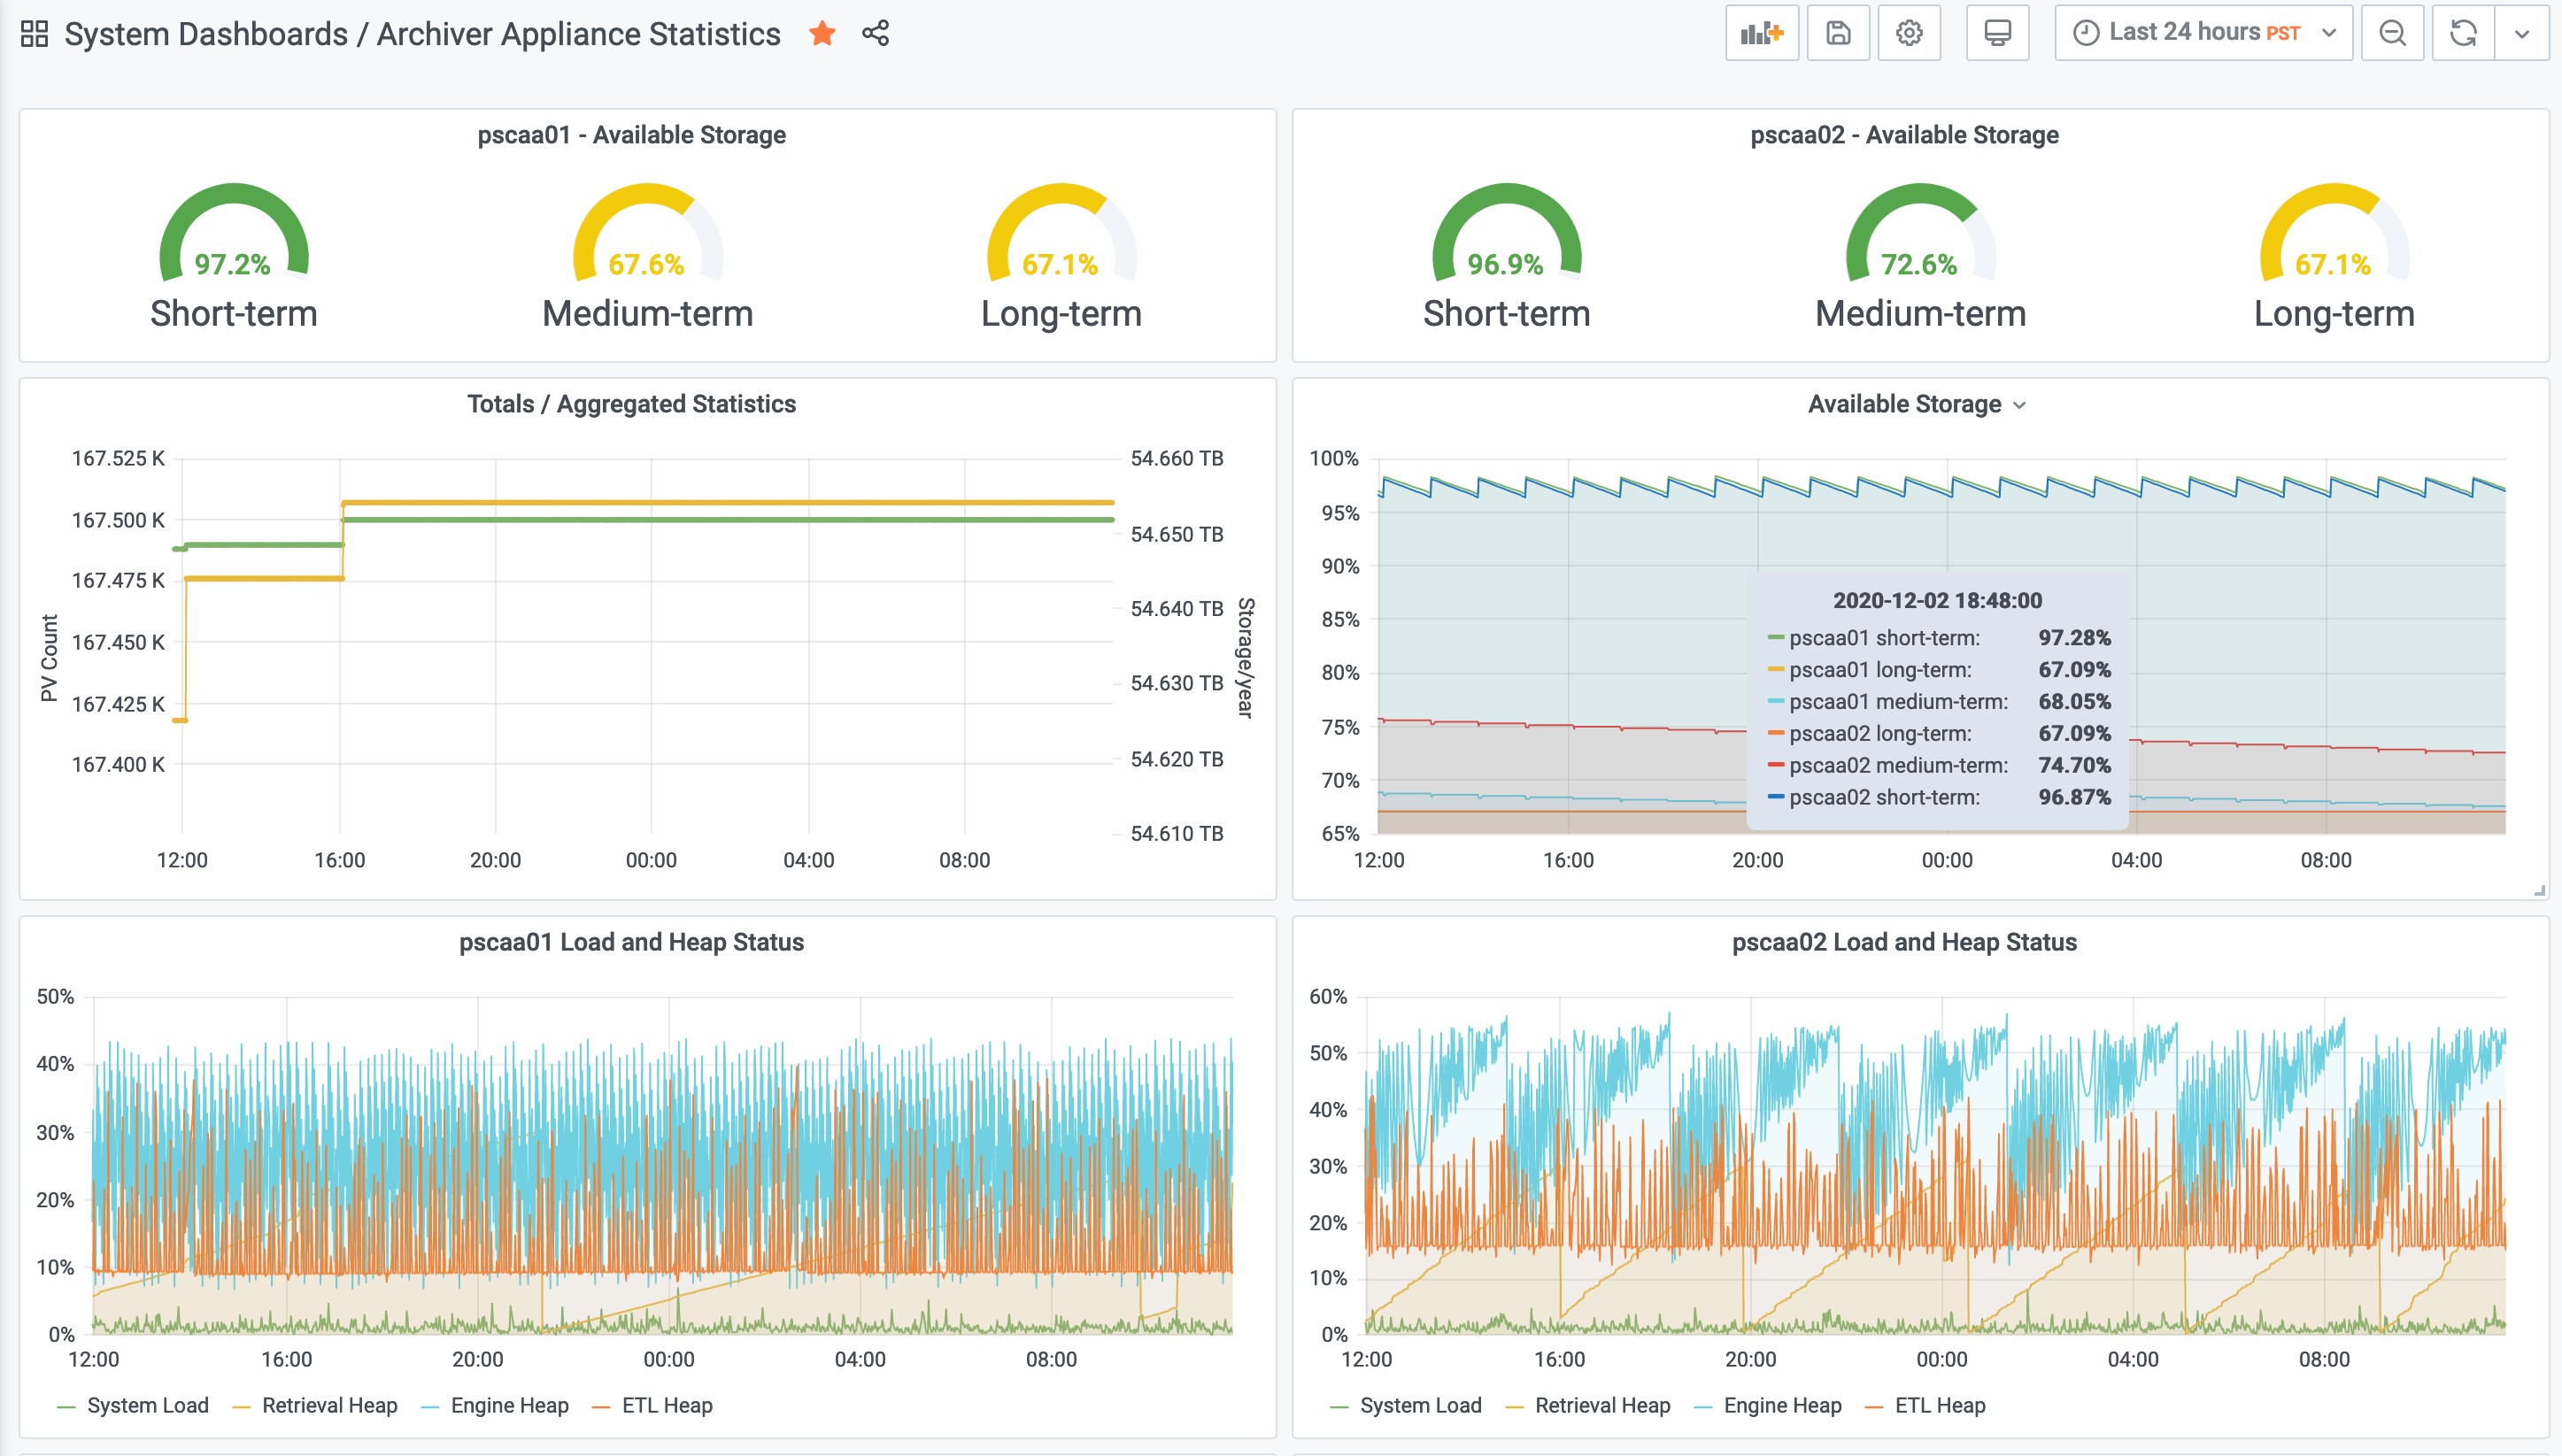
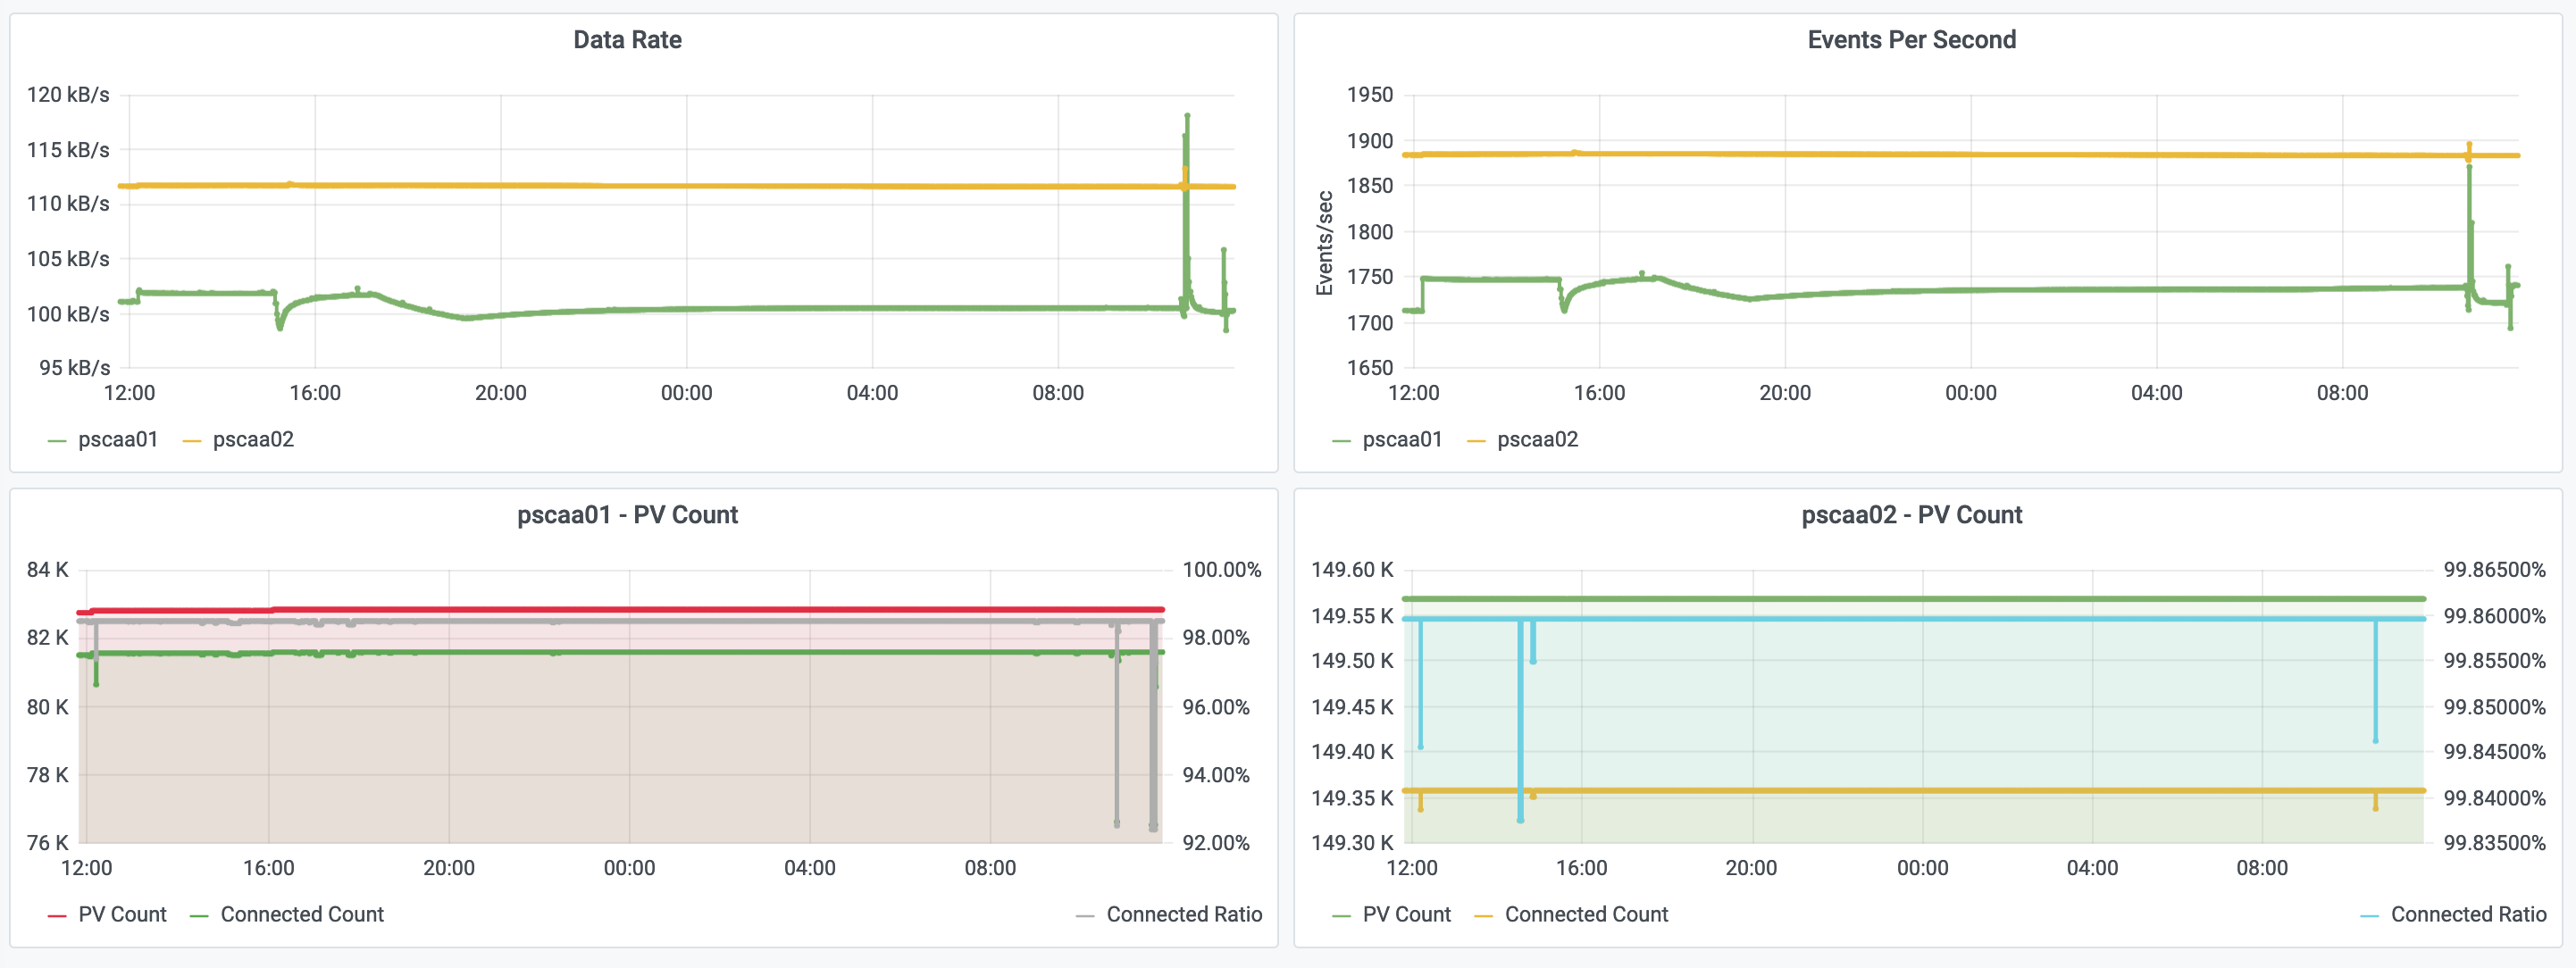
It will need to be tailored for your site, as your elasticsearch index names will depend on your archiver appliance setup.
Elasticsearch Index
By default, the index name will be in the following format:
archiver-appliance-stats
You should consider using this form and rolling over the database every so often with a cron job.
You may also configure it for monthly indices by changing the appropriate environment variables, such as:
ARCHSTATS_INDEX_FORMAT="archiver-metrics-{appliance}"
ARCHSTATS_INDEX_SUFFIX="-%Y.%m"
Which would be specified as follows in Grafana:
[archiver-metrics-APPLIANCE_NAME]-YYYY.MM
Replacing APPLIANCE_NAME_HERE with your appliance name. The YYYY.MM
portion at the end indicates that the index will be updated on a monthly basis.
Elasticsearch handles these multiple indices natively.
With the above, the datasource configuration should look like the following in Grafana:
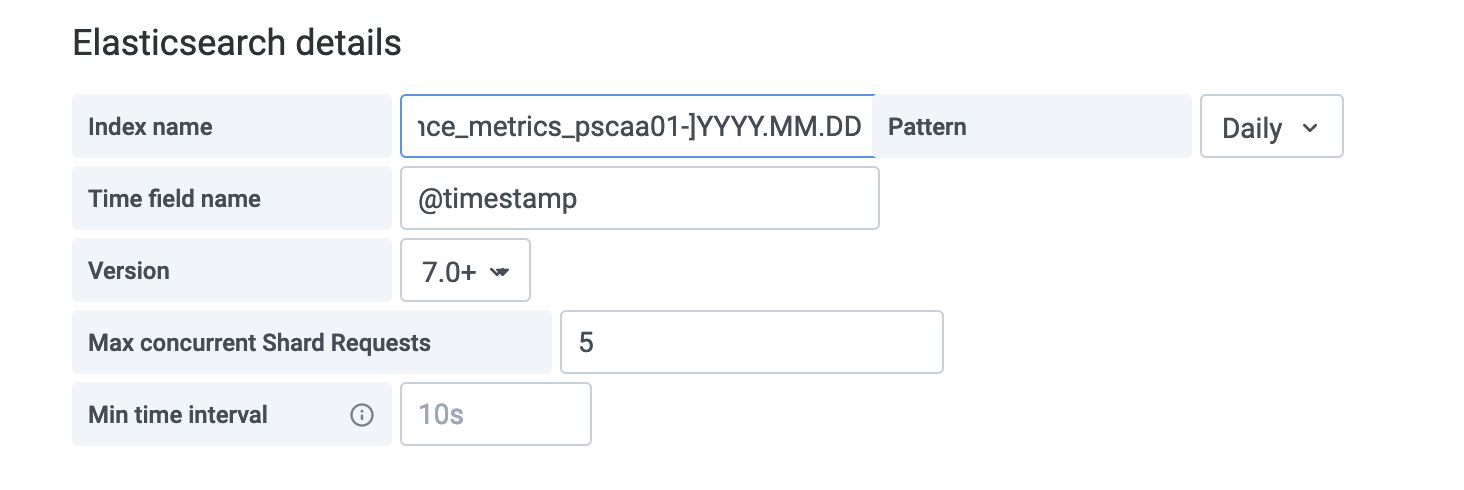
Ensure the data source has a minimum interval of 1 minute configured. This is the pre-determined update rate archstats uses to not overwhelm the archiver, and as such there is no benefit to attempting to display any finer granularity in Grafana panels.